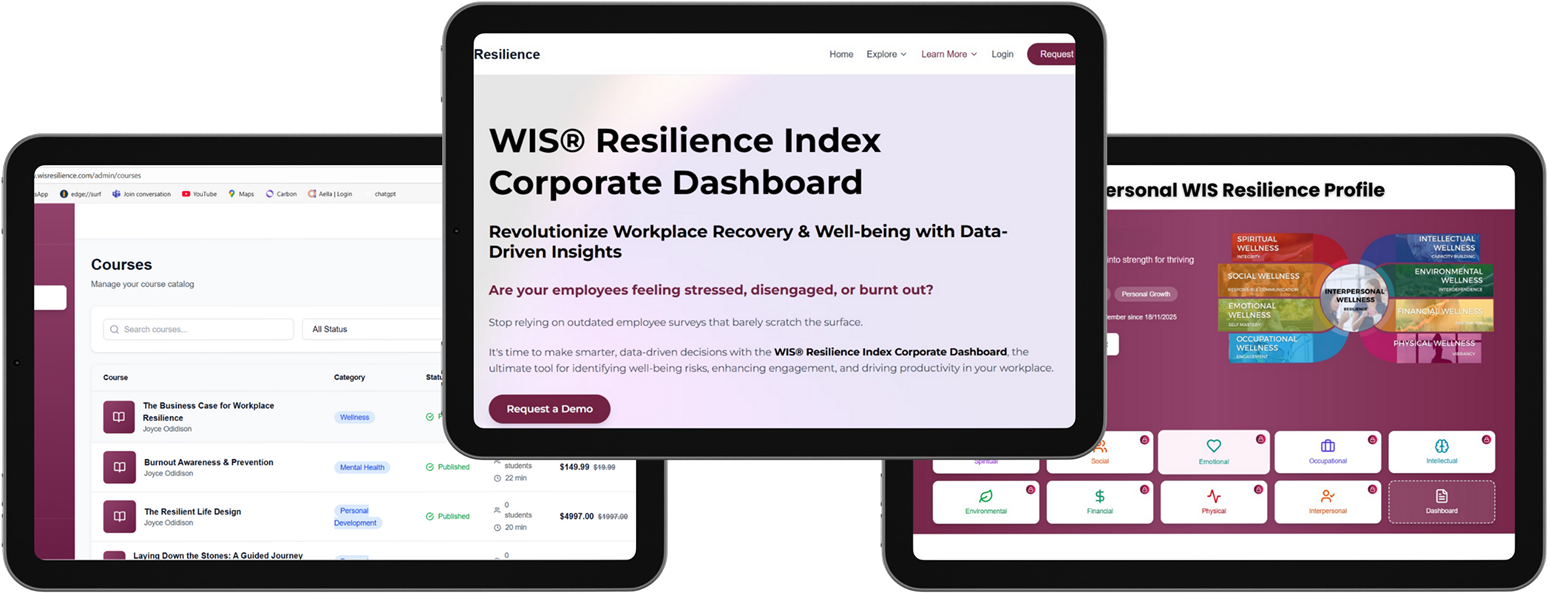
WIS® RESILIENCE INTELLIGENCE PLATFORM
Dashboards + Analytics
The Patterns You Can’t See Yet
Whan and team, department or organization complete the assessment, they get access to the analytics to see what it means and know what to do about it.
Leaders get access to a corporate dashboard for aggregated data only. Individual results stay private. Leaders never see personal scores. What you see instead is the aggregated picture of anonymized, team-level intelligence that shows where the resilience deficit is concentrated and what’s driving it.
You get access to a full reporting tool that gives you data that connects to a decision. Every signal point to a specific intervention.

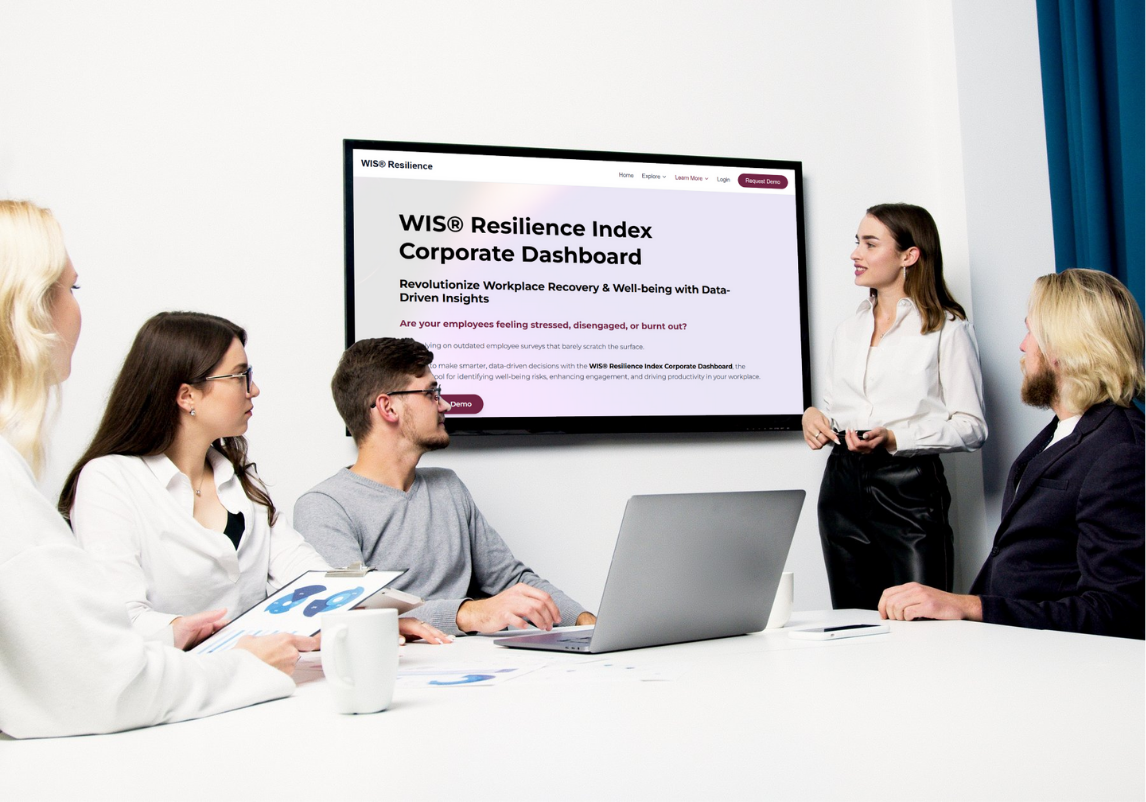
Trusted by leaders in healthcare, education, and industry


WIS® RESILIENCE INTELLIGENCE PLATFORM
Dashboards + Analytics
The Patterns You Can’t See Yet
Whan and team, department or organization complete the assessment, they get access to the analytics to see what it means and know what to do about it.
Leaders get access to a corporate dashboard for aggregated data only. Individual results stay private. Leaders never see personal scores. What you see instead is the aggregated picture of anonymized, team-level intelligence that shows where the resilience deficit is concentrated and what’s driving it.
You get access to a full reporting tool that gives you data that connects to a decision. Every signal point to a specific intervention.
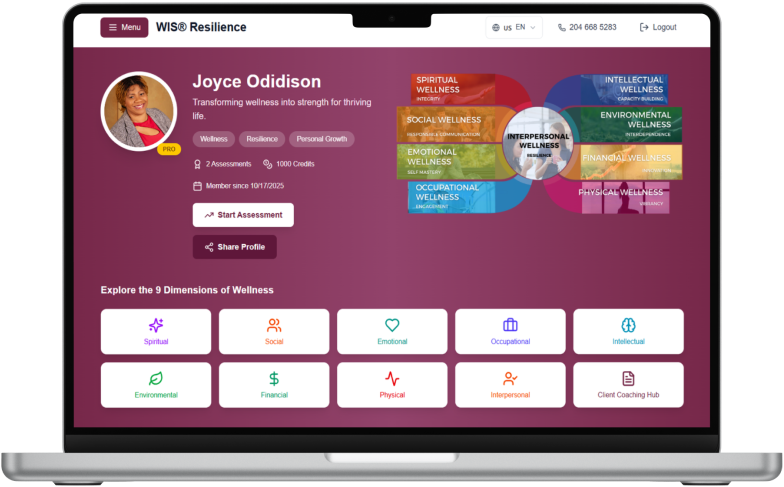
WIS® Resilience Index
What Your Organizational Dashboard Shows

Team Resilience Heat Map
Resilience scores across all nine dimensions, aggregated across your team. You see instantly where capacity is strong and where strain is building. No individual scores. No names. Just the pattern
This is what tells you whether the problem is:
Most leaders are surprised by what the data reveals because the dimension driving the dysfunction is rarely the one they assumed.
Strain Patterns and Early Warning Signals
The dashboards don’t just show a snapshot. It flags where pressure is concentrated and where it’s accelerating. You see early warning signals for burnout, disengagement, and conflict risk before they become grievances, stress leave, or resignations.
This is the difference between managing crises and preventing them.

Dimension-by-Dimension Breakdown
Every dimension is scored and compared. You see where the team is strong, where it’s vulnerable, and critically, where a deficit in one dimension is cascading into others. For example, where an emotional resilience deficit is eroding interpersonal trust; or a financial stress pattern is driving occupational disengagement. The dashboard shows the connections that single-score tools miss completely.
What You Get
This is what you bring to the leadership table when you need to make the case for targeted support, backed by data, not anecdotes.
WIS® Resilience Index
What This Replaces
This replaces engagement surveys that tell you people are unhappy but never why.
It replaces exit interviews that come too late.
It also replaces generic wellness spending that looks proactive but changes nothing because it was never targeted to where the strain actually lives.
The WIS® Dashboards provides specific, dimensional, and actionable data. You see the resilience deficit. You see which dimensions are driving it, and you see exactly what intervention matches what the data is telling you.
WIS® Resilience Index
From Dashboard to Intervention
Based on what the map reveals, we match you to the right level of support:
Resilience Activation Series™
When employees are stretched but there’s no active conflict. Prevention before disruption.
Team Resilience Boost™
Quick alignment and measurable momentum. Fast wins without a full reset.
Team Resilience Reset™
When a team is stuck in recurring friction and needs more than training.
Rapid Conflict Stabilization™
When active conflict containment and stabilization is needed now.
The dashboard tells you which one with compelling data.
WIS® Resilience Index
Tracking Change Over Time
Resilience isn’t static. Neither are the dashboards.
Repeat assessments at 90-day intervals show you whether interventions are working, where new strain is emerging, and what to adjust. You’re not guessing whether the investment paid off. You’re measuring it dimension by dimension, quarter by quarter.
This is how you move from reactive crisis management to proactive resilience infrastructure. Demonstrating measurable impact to leadership without exposing any individual.
Built for Privacy & Psychological Safety
This only works if people answer honestly. That’s why privacy isn’t a feature — it’s the architecture.
Privacy is what makes honest answers possible, and honest answers are what stop leaders from investing in the wrong fix.
WIS® Resilience Index
Built for Privacy & Psychological Safety
This only works if people answer honestly. That’s why privacy isn’t a feature — it’s the architecture.
Privacy is what makes honest answers possible, and honest answers are what stop leaders from investing in the wrong fix.

WIS® Resilience Index
Ready to See What’s Really Happening?
The assessment gives each person clarity. The dashboards give you the leader clarity about the whole team.
The entry point for most organizations